---
title: "Scraping Sugar Prices from Mexico's SNIIM"
subtitle: "A step-by-step walkthrough with an interactive live demo"
author: "dar4datascience"
date: today
format:
html:
theme: cosmo
toc: true
toc-depth: 3
code-fold: true
code-tools: true
highlight-style: github
smooth-scroll: true
fig-width: 9
fig-height: 5
execute:
echo: true
warning: false
message: false
---
## What Is SNIIM?
Mexico's **SNIIM** (*Sistema Nacional de Información e Integración de Mercados*) is a public data portal operated by the Secretaría de Economía. It publishes daily wholesale commodity prices collected from central markets (*centrales de abasto*) across the country — covering everything from fruits and vegetables to grains, livestock, and processed goods like **sugar (azúcar)**.
The portal has been running since the 1990s and remains one of the most granular, freely available sources of food-price data for Mexico. Researchers, agribusinesses, and policymakers use it to track price trends, regional disparities, and supply-chain signals.
::: {.callout-note}
## Why scrape it?
SNIIM does not provide a public API or bulk download button. All data lives in dynamically rendered HTML tables, which makes web scraping the practical path to getting machine-readable data.
:::
---
## The Two Key URLs {#sec-urls}
The sugar section of SNIIM works through a simple two-page form flow:
| Page | URL | Purpose |
|------|-----|---------|
| Search form | `e_SelAzu.asp` | Hosts the market dropdown |
| Results page | `e_Azucar03.asp` | Returns the HTML data table |
The results page accepts query parameters directly, so once you know the market ID and date range you want, you can skip the form entirely and hit the results URL directly.
---
## Step 1 — Discover Available Markets {#sec-step1}
The first function scrapes the search page's `<select name="mercado">` dropdown to build a lookup table of all active markets and their numeric IDs.
```{python}
#| label: fetch-markets
#| code-summary: "fetch_markets() — scrape the market dropdown"
import requests
from bs4 import BeautifulSoup

SEARCH_URL = "https://www.economia-sniim.gob.mx/Sniim-anANT/e_SelAzu.asp"
HEADERS = {
    "User-Agent": "Mozilla/5.0",
    "Accept-Language": "es-MX,es;q=0.9",
}

def fetch_markets() -> list[dict]:
    """
    Scrape the search page to get the list of markets (destinos)
    from the <select name='mercado'> dropdown.

    Returns a list of dicts: [{"id": "100", "label": "DF: Central de …"}, …]
    """
    response = requests.get(SEARCH_URL, headers=HEADERS, timeout=30)
    response.raise_for_status()

    soup = BeautifulSoup(response.text, "lxml")
    select = soup.find("select", {"name": "mercado"})

    if not select:
        raise RuntimeError("Could not find the 'mercado' <select> on the page")

    markets = []
    for option in select.find_all("option"):
        value = option.get("value", "").strip()
        label = option.get_text(strip=True)
        if value and value != "-1":
            markets.append({"id": value, "label": label})

    return markets

markets = fetch_markets()
print(f"Found {len(markets)} markets. First five:")
for m in markets[:5]:
    print(f"  id={m['id']:>4}  {m['label']}")
```
::: {.callout-tip}
## Finding your market ID
Run `python scrape_azucar_example.py --list-markets` to print every available market with its ID. IDs can shift if SNIIM adds or removes markets, so it's good practice to re-discover them before a long data pull.
:::
---
## Step 2 — Build the Query URL {#sec-step2}
The results page accepts eight query parameters. The most important ones are `mercado` (market ID), `mes` (month), `anio` (year), `dia1` and `dia2` (day range). The rest are filters for product type and sugar mill — leaving them at `1` returns all records.
```{python}
#| label: build-url
#| code-summary: "build_query_url() — construct the parameterised URL"
from urllib.parse import urlencode

RESULTS_URL = "https://www.economia-sniim.gob.mx/Sniim-anANT/e_Azucar03.asp"

def build_query_url(
    mercado_id: str,
    dia_inicio: str = "01",
    dia_fin: str = "31",
    mes: str = "01",
    anio: str = "2025",
) -> str:
    """
    Construct the full results URL with query parameters.

    Parameters
    ----------
    mercado_id : numeric string, e.g. "100"
    dia_inicio : start day within the month ("01"–"31")
    dia_fin    : end day within the month ("01"–"31")
    mes        : two-digit month string ("01"–"12")
    anio       : four-digit year string
    """
    params = {
        "producto": "1",
        "ingenio":  "1",
        "mercado":  mercado_id,
        "dia1":     dia_inicio,
        "dia2":     dia_fin,
        "mes":      mes,
        "anio":     anio,
        "detalle":  "S",
        "x":        "45",
        "y":        "15",
    }
    return f"{RESULTS_URL}?{urlencode(params)}"

example_url = build_query_url("100", mes="01", anio="2025")
print("Example URL:")
print(example_url)
```
---
## Step 3 — Parse the HTML Response {#sec-step3}
The results page returns one or more `<table border="1">` blocks. Each table covers a single product type (e.g. *Azúcar Estándar* or *Azúcar Morena*) and includes a header section identifying the market name and product, followed by dated price rows.
```{python}
#| label: parse-html
#| code-summary: "parse_azucar_html() — extract tables into a DataFrame"
import pandas as pd

def parse_azucar_html(html: str) -> pd.DataFrame:
    """
    Parse the SNIIM azúcar results page.

    HTML structure per table
    ------------------------
    - td.encabDES  → market name
    - td.encabTIP  → product type (Azúcar Estándar / Morena / …)
    - td.encabTAB  → column headers (Fecha, Ingenio, Precio encuestado)
    - td.Datos / td.DatosNum → data cells
    """
    soup = BeautifulSoup(html, "lxml")
    tables = soup.find_all("table", {"border": "1"})

    all_rows: list[dict] = []

    for table in tables:
        market_cell = table.find("td", {"class": "encabDES"})
        if not market_cell:
            continue
        market_name = market_cell.get_text(strip=True)

        product_cell = table.find("td", {"class": "encabTIP"})
        product_type = product_cell.get_text(strip=True) if product_cell else "Desconocido"

        header_row = None
        for row in table.find_all("tr"):
            if row.find("td", {"class": "encabTAB"}):
                header_row = row
                break

        if not header_row:
            continue

        col_names = [
            " ".join(cell.get_text(strip=True).split())
            for cell in header_row.find_all("td", {"class": "encabTAB"})
        ]

        for row in table.find_all("tr"):
            cells = row.find_all(["td", "th"], class_=["Datos", "DatosNum"])
            if len(cells) < 3:
                continue
            values = [cell.get_text(strip=True) for cell in cells[:3]]
            record = dict(zip(col_names, values))
            record["Mercado"] = market_name
            record["Tipo Producto"] = product_type
            all_rows.append(record)

    if not all_rows:
        return pd.DataFrame()

    df = pd.DataFrame(all_rows)
    if "Fecha" in df.columns:
        df["Fecha"] = pd.to_datetime(df["Fecha"], format="%d/%m/%Y", errors="coerce")
    price_col = next((c for c in df.columns if "Precio" in c), None)
    if price_col:
        df[price_col] = (
            df[price_col].str.replace(",", "", regex=False).astype(float)
        )
    return df
```
::: {.callout-warning}
## HTML class names can drift
SNIIM occasionally tweaks its page templates. If parsing breaks, open DevTools on the results page, find the data tables, and update the CSS class names (`encabDES`, `encabTAB`, `Datos`, `DatosNum`) in `parse_azucar_html`.
:::
---
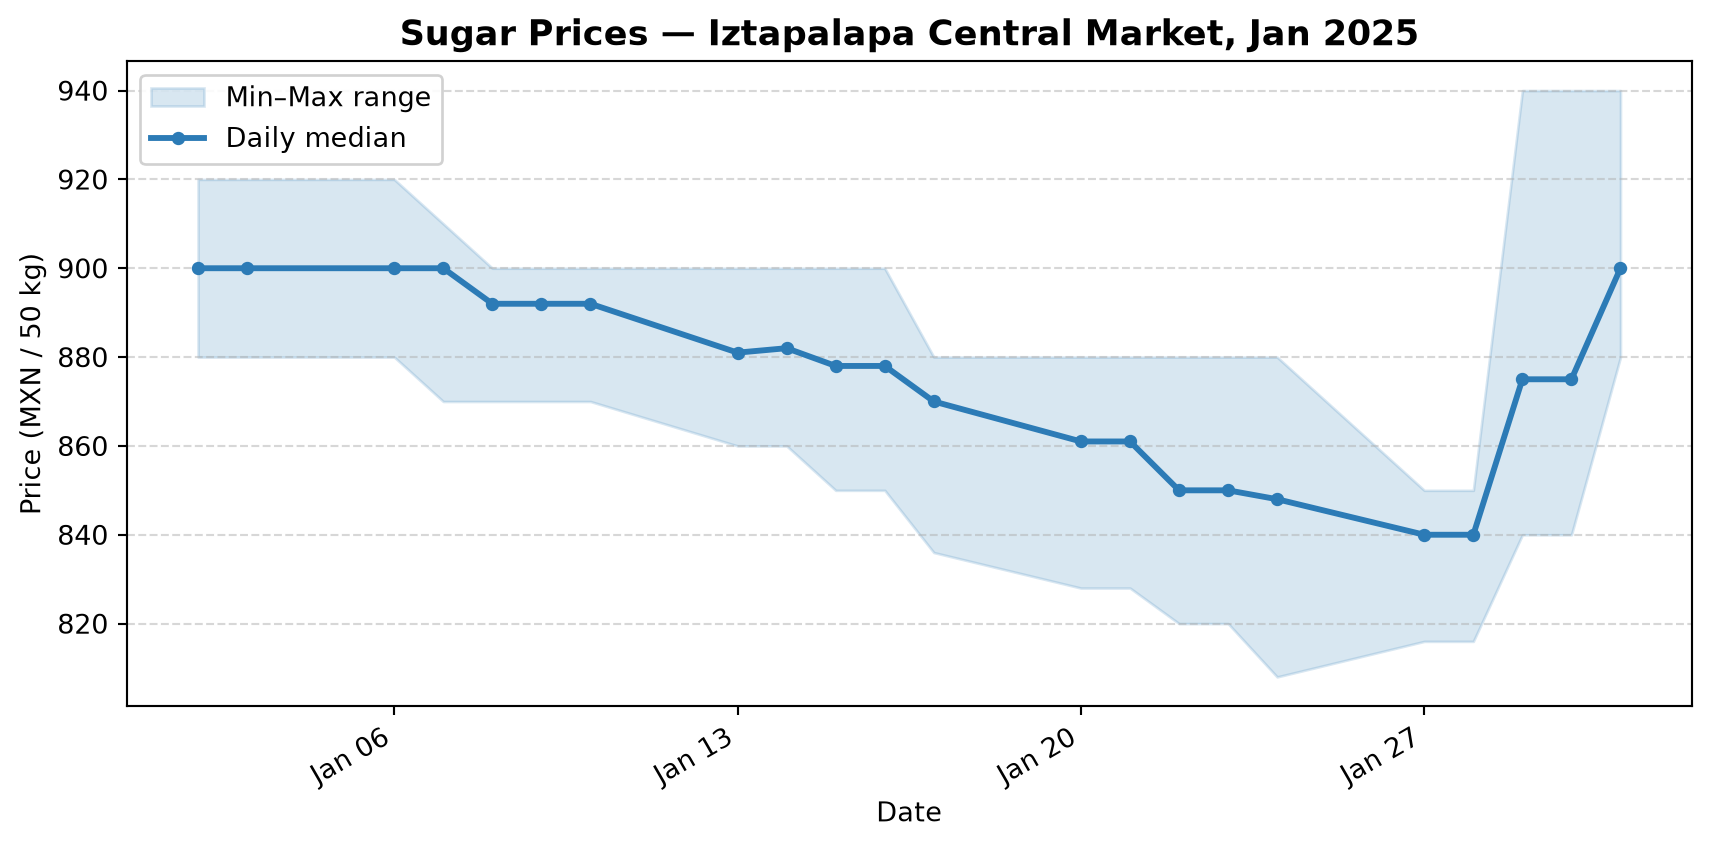
## Static Preview — January 2025, Market 100 {#sec-preview}
The sample below was pre-fetched and saved to `data/azucar_sample.csv` so this page renders without hitting SNIIM every time.
```{python}
#| label: fig-price-trend
#| fig-cap: "Daily median sugar price — Central de Abasto Iztapalapa, January 2025"
#| code-summary: "Load sample data and plot"
import pandas as pd
import matplotlib.pyplot as plt
import matplotlib.dates as mdates

df = pd.read_csv("data/azucar_sample.csv", parse_dates=["Fecha"])
df["Precioencuestado"] = pd.to_numeric(df["Precioencuestado"], errors="coerce")

price_col = "Precioencuestado"

daily = (
    df.groupby("Fecha")[price_col]
    .agg(["median", "min", "max"])
    .reset_index()
)

fig, ax = plt.subplots(figsize=(9, 4.5))
ax.fill_between(daily["Fecha"], daily["min"], daily["max"],
                alpha=0.18, color="#2c7bb6", label="Min–Max range")
ax.plot(daily["Fecha"], daily["median"],
        color="#2c7bb6", linewidth=2.2, marker="o", markersize=4,
        label="Daily median")

ax.set_xlabel("Date")
ax.set_ylabel("Price (MXN / 50 kg)")
ax.set_title("Sugar Prices — Iztapalapa Central Market, Jan 2025",
             fontsize=13, fontweight="bold")
ax.xaxis.set_major_formatter(mdates.DateFormatter("%b %d"))
ax.xaxis.set_major_locator(mdates.WeekdayLocator(byweekday=mdates.MO))
plt.xticks(rotation=30, ha="right")
ax.legend(framealpha=0.9)
ax.grid(axis="y", linestyle="--", alpha=0.5)
fig.tight_layout()
plt.show()
```
```{python}
#| label: tbl-sample
#| tbl-cap: "First 10 rows of the sample dataset"
#| code-summary: "Show data table"
df.head(10).style.format({"Fecha": lambda d: d.strftime("%Y-%m-%d"),
                           price_col: "{:,.2f}"})
```
---
## Interactive Live Demo {#sec-demo}
The widget below runs entirely in your browser using **Shinylive** (Python + Shiny compiled to WebAssembly). It fetches fresh data directly from SNIIM, parses the HTML response, and displays the result — no server required.
Choose a market, pick a month and year, and click **Fetch Data** to see live prices.
::: {.callout-important}
## Live network request from your browser
Shinylive runs Python in WebAssembly — all HTTP calls go through the browser's `fetch` API, which enforces CORS. Since SNIIM's server does not send `Access-Control-Allow-Origin` headers, requests are routed through [corsproxy.io](https://corsproxy.io) as a transparent relay. If SNIIM is unavailable or the proxy is rate-limited, the app will display the error message.
:::
```{shinylive-python}
#| standalone: true
#| viewerHeight: 700
from bs4 import BeautifulSoup
from urllib.parse import urlencode
import pandas as pd
from shiny import App, ui, render, reactive
# ── Constants ────────────────────────────────────────────────────────────────
SEARCH_URL = "https://www.economia-sniim.gob.mx/Sniim-anANT/e_SelAzu.asp"
RESULTS_URL = "https://www.economia-sniim.gob.mx/Sniim-anANT/e_Azucar03.asp"
CORS_PROXY = "https://corsproxy.io/?url="
# ── Helpers ──────────────────────────────────────────────────────────────────
def proxied(url: str) -> str:
"""Prefix a URL with the CORS proxy so browser fetch can reach SNIIM."""
return CORS_PROXY + url
async def fetch_markets():
from pyodide.http import pyfetch
r = await pyfetch(proxied(SEARCH_URL))
html = await r.string()
soup = BeautifulSoup(html, "html.parser")
select = soup.find("select", {"name": "mercado"})
if not select:
return []
return [
{"id": opt.get("value", "").strip(), "label": opt.get_text(strip=True)}
for opt in select.find_all("option")
if opt.get("value", "").strip() not in ("", "-1")
]
def build_url(mercado_id, mes, anio, dia1="01", dia2="31"):
params = {
"producto": "1", "ingenio": "1",
"mercado": mercado_id, "dia1": dia1, "dia2": dia2,
"mes": mes, "anio": anio, "detalle": "S", "x": "45", "y": "15",
}
return f"{RESULTS_URL}?{urlencode(params)}"
def parse_html(html):
soup = BeautifulSoup(html, "html.parser")
tables = soup.find_all("table", {"border": "1"})
rows = []
for table in tables:
mc = table.find("td", {"class": "encabDES"})
if not mc:
continue
pc = table.find("td", {"class": "encabTIP"})
product = pc.get_text(strip=True) if pc else "Desconocido"
header_row = next(
(r for r in table.find_all("tr") if r.find("td", {"class": "encabTAB"})),
None,
)
if not header_row:
continue
cols = [" ".join(c.get_text(strip=True).split())
for c in header_row.find_all("td", {"class": "encabTAB"})]
for row in table.find_all("tr"):
cells = row.find_all(["td", "th"], class_=["Datos", "DatosNum"])
if len(cells) < 3:
continue
rec = dict(zip(cols, [c.get_text(strip=True) for c in cells[:3]]))
rec["Mercado"] = mc.get_text(strip=True)
rec["Tipo Producto"] = product
rows.append(rec)
if not rows:
return pd.DataFrame()
df = pd.DataFrame(rows)
if "Fecha" in df.columns:
df["Fecha"] = pd.to_datetime(df["Fecha"], format="%d/%m/%Y", errors="coerce")
price_col = next((c for c in df.columns if "Precio" in c), None)
if price_col:
df[price_col] = pd.to_numeric(
df[price_col].str.replace(",", "", regex=False), errors="coerce"
)
return df
# ── UI ───────────────────────────────────────────────────────────────────────
YEARS = [str(y) for y in range(2020, 2026)]
MONTHS = {
"01": "January", "02": "February", "03": "March", "04": "April",
"05": "May", "06": "June", "07": "July", "08": "August",
"09": "September","10": "October", "11": "November", "12": "December",
}
app_ui = ui.page_sidebar(
ui.sidebar(
ui.h5("Query Parameters"),
ui.input_select("market_id", "Market ID", choices={"100": "Loading markets…"}),
ui.input_select("year", "Year", choices=YEARS, selected="2025"),
ui.input_select("month", "Month", choices=MONTHS, selected="01"),
ui.input_slider("day_start", "Start day", min=1, max=31, value=1),
ui.input_slider("day_end", "End day", min=1, max=31, value=31),
ui.input_action_button("fetch", "Fetch Data", class_="btn-primary w-100 mt-2"),
ui.hr(),
ui.output_text("status"),
width=280,
),
ui.navset_tab(
ui.nav_panel(
"Table",
ui.output_data_frame("data_table"),
),
ui.nav_panel(
"Price Chart",
ui.output_plot("price_chart", height="400px"),
),
ui.nav_panel(
"Query URL",
ui.output_code("query_url"),
),
),
title="SNIIM Azúcar — Live Query",
fillable=True,
)
# ── Server ───────────────────────────────────────────────────────────────────
def server(input, output, session):
# Load markets once on startup
@reactive.effect
async def _load_markets():
try:
markets = await fetch_markets()
choices = {m["id"]: f"{m['id']} — {m['label']}" for m in markets}
ui.update_select("market_id", choices=choices, selected="100")
except Exception as e:
ui.update_select("market_id", choices={"err": f"Error: {e}"})
# Reactive data fetch (only on button click)
result = reactive.value(pd.DataFrame())
error_msg = reactive.value("")
@reactive.effect
@reactive.event(input.fetch)
async def _fetch():
error_msg.set("")
try:
from pyodide.http import pyfetch
url = build_url(
input.market_id(),
str(input.month()).zfill(2),
str(input.year()),
str(input.day_start()).zfill(2),
str(input.day_end()).zfill(2),
)
r = await pyfetch(proxied(url))
html = await r.string()
df = parse_html(html)
result.set(df)
if df.empty:
error_msg.set("No data returned for this query.")
except Exception as e:
error_msg.set(f"Error: {e}")
result.set(pd.DataFrame())
@output
@render.text
def status():
if error_msg():
return f"⚠ {error_msg()}"
df = result()
if df.empty:
return "Click 'Fetch Data' to load."
return f"✓ {len(df)} rows loaded."
@output
@render.data_frame
def data_table():
df = result()
if df.empty:
return render.DataGrid(pd.DataFrame())
display = df.copy()
if "Fecha" in display.columns:
display["Fecha"] = display["Fecha"].dt.strftime("%Y-%m-%d")
return render.DataGrid(display, filters=True, width="100%")
@output
@render.plot
def price_chart():
import matplotlib.pyplot as plt
import matplotlib.dates as mdates
df = result()
fig, ax = plt.subplots(figsize=(8, 4))
if df.empty or "Fecha" not in df.columns:
ax.text(0.5, 0.5, "No data — fetch first",
ha="center", va="center", transform=ax.transAxes, fontsize=13)
ax.axis("off")
return fig
price_col = next((c for c in df.columns if "Precio" in c), None)
if price_col is None:
ax.text(0.5, 0.5, "Price column not found",
ha="center", va="center", transform=ax.transAxes, fontsize=13)
ax.axis("off")
return fig
daily = (
df.groupby("Fecha")[price_col]
.agg(["median", "min", "max"])
.reset_index()
)
ax.fill_between(daily["Fecha"], daily["min"], daily["max"],
alpha=0.18, color="#2c7bb6", label="Min–Max range")
ax.plot(daily["Fecha"], daily["median"],
color="#2c7bb6", linewidth=2, marker="o", markersize=4,
label="Daily median")
ax.set_xlabel("Date")
ax.set_ylabel("Price (MXN / 50 kg)")
ax.set_title("Sugar Prices by Day", fontsize=12, fontweight="bold")
ax.xaxis.set_major_formatter(mdates.DateFormatter("%b %d"))
plt.xticks(rotation=30, ha="right")
ax.legend(framealpha=0.9)
ax.grid(axis="y", linestyle="--", alpha=0.5)
fig.tight_layout()
return fig
@output
@render.code
def query_url():
return build_url(
input.market_id(),
str(input.month()).zfill(2),
str(input.year()),
str(input.day_start()).zfill(2),
str(input.day_end()).zfill(2),
)
app = App(app_ui, server)
```
---
## Run It Yourself {#sec-cli}
Clone the repository and run the script locally — no Quarto needed.
```bash
# Install dependencies
pip install requests beautifulsoup4 lxml pandas

# Run with defaults (market 100, Jan 2025)
python scrape_azucar_example.py

# List all available market IDs
python scrape_azucar_example.py --list-markets

# Custom query
python scrape_azucar_example.py \
  --market-id 100 \
  --year 2025 --month 03 \
  --day-start 01 --day-end 31 \
  --output my_data.csv

# Find a market by name instead of ID
python scrape_azucar_example.py --market-query "Guadalajara"
```
::: {.callout-note}
## SNIIM availability
SNIIM is a government portal and can be slow or intermittently unavailable. If you get a timeout, wait a few minutes and retry. The `--no-save` flag lets you preview results without writing any file.
:::
---
## Further Reading {#sec-further}
- **SNIIM portal**: <https://www.economia-sniim.gob.mx>
- **Secretaría de Economía**: <https://www.gob.mx/se>
- **Quarto + Shinylive docs**: <https://quarto-ext.github.io/shinylive/>
- **Source code**: <https://github.com/dar4datascience/Demo-SNIIM-Mexico>